Looking Back at a Rocky First Half of 2022
Financial markets remained unsettled and volatile during the second quarter. The stock market’s trend changed multiple times as investors continued to search for direction amid a sea of changing conditions. The S&P 500 finished the second quarter with its worst three-month period since the first quarter of 2020 and worst first half of a calendar year since 1970. This quarter’s letter recaps the first half of 2022 and discusses the top investment themes heading into the second half of 2022.
2nd Quarter Sees a Mixture of Old & New Themes
Investors navigated a combination of old and new investment themes during the second quarter. Inflation pressures remained top of mind as the headline CPI accelerated at a more than +8% year-over-year pace during both April and May. In response to persistent inflation, the Federal Reserve continued to tighten monetary policy by raising interest rates at each of the April, May, and June meetings. Like the first quarter, stocks traded lower as the interest rate increases caused investors to dial back their risk taking.
Multiple new themes also emerged during the second quarter. Several retailers, including Walmart and Target, reported substantial inventory buildups as inflation pressured consumer spending on discretionary items. The retailers warned their profit margins could decline in the coming quarters as they may need to mark down items to clear the excess inventories. From a monetary policy perspective, the Fed supplemented its interest rate increases by starting to shrink its balance sheet. The Fed is opting not to reinvest the proceeds of up to $30 billion of maturing Treasury securities and up to $17.5 billion of maturing mortgage-backed securities per month. The decision is another way for the Fed to decrease the amount of money supply and liquidity.
Federal Reserve Gets Aggressive at June Meeting
The Federal Reserve adopted a more aggressive tightening stance at its mid-June meeting. The central bank raised the federal funds rate +0.75% and unveiled a ‘strong commitment’ to bring inflation back down to 2%. For historical context, June was the first +0.75% increase since 1994. The Fed’s latest moves are another indication of how 40-year high inflation readings are driving the Fed’s monetary policy decisions.
How does the current cycle compare to prior cycles? Figure 1 compares the current cycle’s federal funds rate path against the last five cycles. Factoring in the +0.75% increase at the June meeting, the Fed has raised interest rates +1.50% since the first increase in March. Investors expect the Fed to maintain its +0.75% pace at the late-July meeting, which would make 2022 the fastest +2.25% increase compared to the last five cycles. Market consensus calls for the Fed to keep raising interest rates at its meetings later this year, although the number and size of the increases remain open questions.
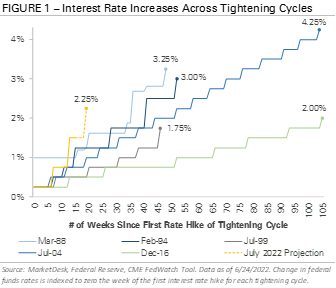
The June meeting represents a potential turning point. Why? Throughout the first half of 2022, investors were concerned the Fed was not being aggressive enough to combat persistent inflation pressures. The thinking was inflation could become entrenched if the Fed raised rates too slow, which could force the Fed to raise interest rates for a longer period and to a higher endpoint. The June meeting marks a clear change in the Fed’s thinking and indicates the central bank will front-load interest rate hikes if necessary to ease inflation pressures.
Investors initially reacted positively to the Fed’s updated guidance. The S&P 500 was down -19.1% from the start of the second quarter through the Fed’s meeting on June 16th. From June 16th through June 24th, the S&P 500 gained almost 6.7%, and Treasury yields declined. Why does this matter? The equity rally and declining Treasury yields suggest investors became slightly more confident the Fed’s aggressive tightening upfront could get inflation under control sooner. The quicker inflation is under control, the sooner the Fed may be able to slow its interest rate hikes and evaluate policy more rationally.
To be fair, there is a potential downside to the Fed’s new tightening approach, and the market appears to be focused on the risk as the second quarter ends. There isn’t a clear understanding of how fast or how much the Fed’s actions will impact the economy. There is a risk the impact from the Fed’s actions is delayed and the Fed keeps raising interest rates, potentially overtightening and slowing economic activity more than expected over the next 12-18 months. It’s a delicate balancing act for the Fed to pull off.
Economic Data Continues to Point to Softer Growth
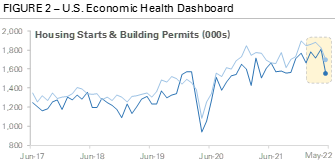
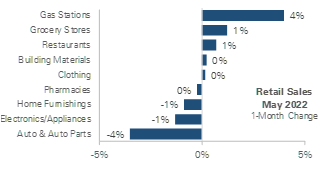
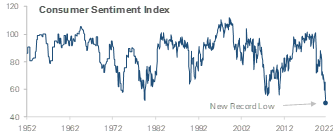
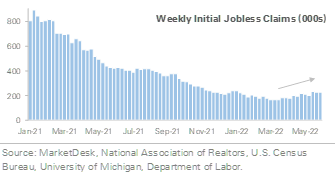
The latest economic data indicates investors are justified in worrying about the Fed overtightening and tipping the U.S. economy into a recession. The stacked charts in Figure 2 track a range of economic indicators across housing, consumer confidence, the labor market, and consumer spending. The data remains strong relative to historical standards, but it does indicate the U.S. economy is starting to soften.
The first chart tracks the annualized pace of housing starts and building permits. Housing demand soared during the pandemic, but both starts and permits have declined more than -10% on an annualized basis since the end of 2021. The housing market slowdown coincides with a more than +2.50% increase in the 30-year fixed mortgage rate since the end of 2021, suggesting rising mortgage rates are already pressuring housing demand.
The second chart tracks month-over-month retail sales growth across multiple categories during May. It shows consumers spent more at gas stations and grocery stores as gasoline and food prices rose and less on discretionary-related goods, such as autos and auto parts, electronics and appliances, and home furnishings. The data offers a near-term look at how high inflation is impacting and shifting consumer spending.
The third chart tracks the University of Michigan’s Consumer Sentiment Index. The index made a new record low of 50 during June as consumer sentiment continued to deteriorate. Weaker consumer confidence coincides with high inflation and points to a worried U.S. consumer, which is concerning because the consumer accounts for nearly 70% of U.S. economic activity.
The fourth chart tracks weekly initial jobless claims. While initial jobless claims remain low by historical standard, the trend has reversed from 2021’s steady decline as jobless claims drift higher during 2022. Separate data from the Bureau of Labor Statistics shows the U.S. continues to add new jobs each month, but the pace of those job gains has slowed significantly compared to 2021. The +390,000 jobs added during May 2022 were the slowest pace since April 2021. The two measures indicate labor demand is softening, a notable change from the last 12 months when businesses struggled to fill open jobs.
Equity Market Recap – Another Difficult Quarter
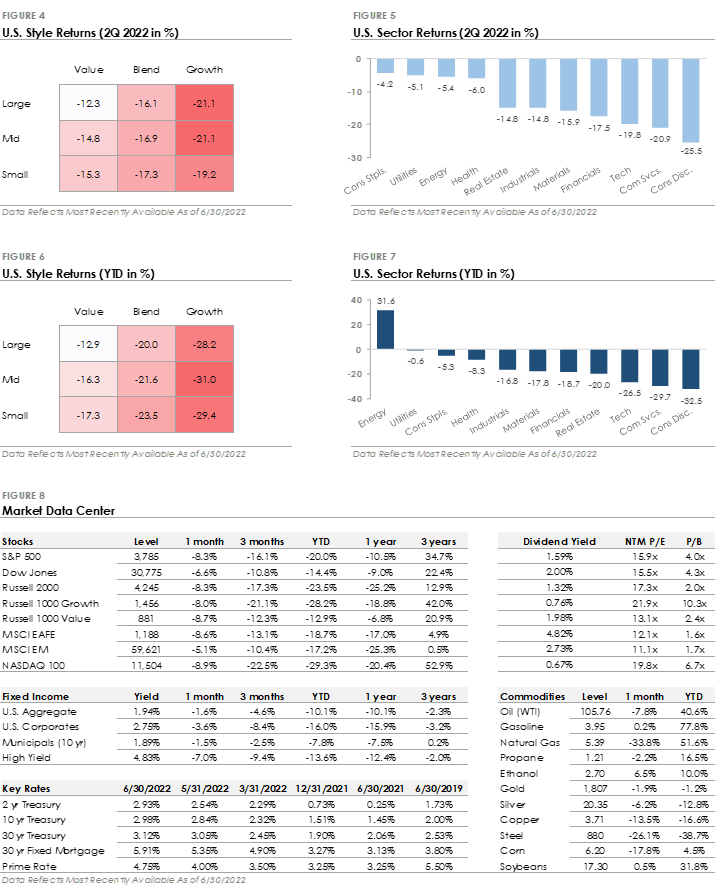
The second quarter was another difficult environment for equities. The S&P 500 Index lost -16.1%, only slightly outperforming the Russell 2000 Index’s -17.3% return. It was an especially difficult quarter for Growth stocks as rising interest rates continued to pressure valuations. The Russell 1000 Growth Index traded down -21.1% and underperformed the Russell 1000 Value Index’s -12.3% return. The Nasdaq 100 Index, which investors view as a concentrated Growth index due to its Tech overweight, traded down -22.5% during the second quarter.
U.S. sector returns offer another look at second quarter performance trends. Energy and defensive sectors, including Consumer Staples, Utilities, and Health Care, outperformed as investors rotated to commodities and risk off assets. Growth-style sectors, which include Consumer Discretionary, Communication Services, and Technology, underperformed the broad market as rising interest rates pressured Growth stocks. In the middle, cyclical sectors, including Materials, Industrials, and Financials, performed in line with the S&P 500.
International markets’ lower exposure to expensive Growth stocks allowed them to outperform U.S. markets during the second quarter. The MSCI EAFE Index of developed market stocks returned -13.1% during the quarter, while the MSCI EM Index of emerging market stocks returned -10.4%. Despite international stocks’ outperformance during the second quarter, questions remain about the impact of rising energy prices in Europe and tighter financial conditions in emerging markets (i.e., higher interest rates & lower liquidity).
Bond Market Recap – Rising Treasury Yields Lead to Additional Losses
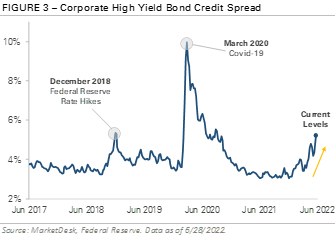
Bonds traded lower during the second quarter as Treasury yields continued to rise in anticipation of tighter Fed policy. Corporate investment grade bonds produced a -8.4% total return, slightly outperforming the -9.4% total return generated by corporate high yield bonds. While investment grade bonds outperformed in aggregate during the second quarter, the group’s outperformance versus high yield bonds primarily occurred during the second half of June after the Fed’s new aggressive tightening stance caused investors to grow concerned about slower economic activity.
Figure 3 tracks the interest rate spread between corporate high yield bonds and Treasury bonds. The spread is a measure of credit risk, more specifically how much more yield investors demand in order to loan to riskier companies. The chart shows the spread widened significantly from 3.40% at the start of the second quarter to 5.26% on June 28th. The wider spread indicates investors are concerned about borrowers’ ability to make principal and interest payments as financial conditions tighten. Looking back at the past five years, the 5.26% spread is near levels last seen during late 2020, the months following the Covid outbreak, and late 2018, the last time the Fed raised interest rates.
Second Half 2022 Outlook – Unanswered Questions
The outlook is indecisive as financial markets close out a volatile first half of the year. Some investors believe the Fed’s actions will dramatically slow economic growth and push the U.S. economy into a recession. On the opposite end of the spectrum, some investors believe the U.S. economy is strong enough to withstand the Fed’s actions and view the stock market as oversold.
The back and forth is likely to continue until some of the market’s most pressing questions are answered. Key questions include the direction of Federal Reserve policy, inflation’s stickiness, the trajectory of corporate earnings growth and forward earnings estimates, and the path of economic growth. Our team will be monitoring the answers to these questions in coming months to help guide investment portfolio positioning.
The current investing environment requires a long-term outlook. Trend changes are frequent, fast, and driven by fluctuating market headlines, and keeping up with the day-to-day whims of the market can be emotionally taxing. Developing a financial plan and sticking to it are important steps to achieving your financial goals.
This Quarter in Numbers
Disclosures
CF Financial (“RIA Firm”) is a registered investment adviser. Information presented is for educational purposes only intended for a broad audience. The information does not intend to make an offer or solicitation for the sale or purchase of any specific securities, investments, or investment strategies. Investments involve risk and are not guaranteed. CF Financial has reasonable belief that this marketing does not include any false or material misleading statements or omissions of facts regarding services, investment, or client experience. CF Financial has reasonable belief that the content as a whole will not cause an untrue or misleading implication regarding the adviser’s services, investments, or client experiences. Past performance is not indicative of future performance.
CF Financial is not giving tax, legal or accounting advice, consult a professional tax or legal representative if needed.

